Maria Fernanda, a quantum physics Ph.D. and CEO of MOCA Platform, explain us in a simple way how companies can extract business value using big data in order to increase revenue and maximize profitability.
Can we predict our website traffic?
In our last post we introduced John, the owner of an online travel agency who invested in data analysis and hired a new salesperson for his London store. After a year, he got a 20% increase in sales due to the decisions he made as a result of his data analysis.
Now, John wants to perform a new data study to continue being innovative in that area.
The analyst requests new data from John and is able to then show him the information in a different way.
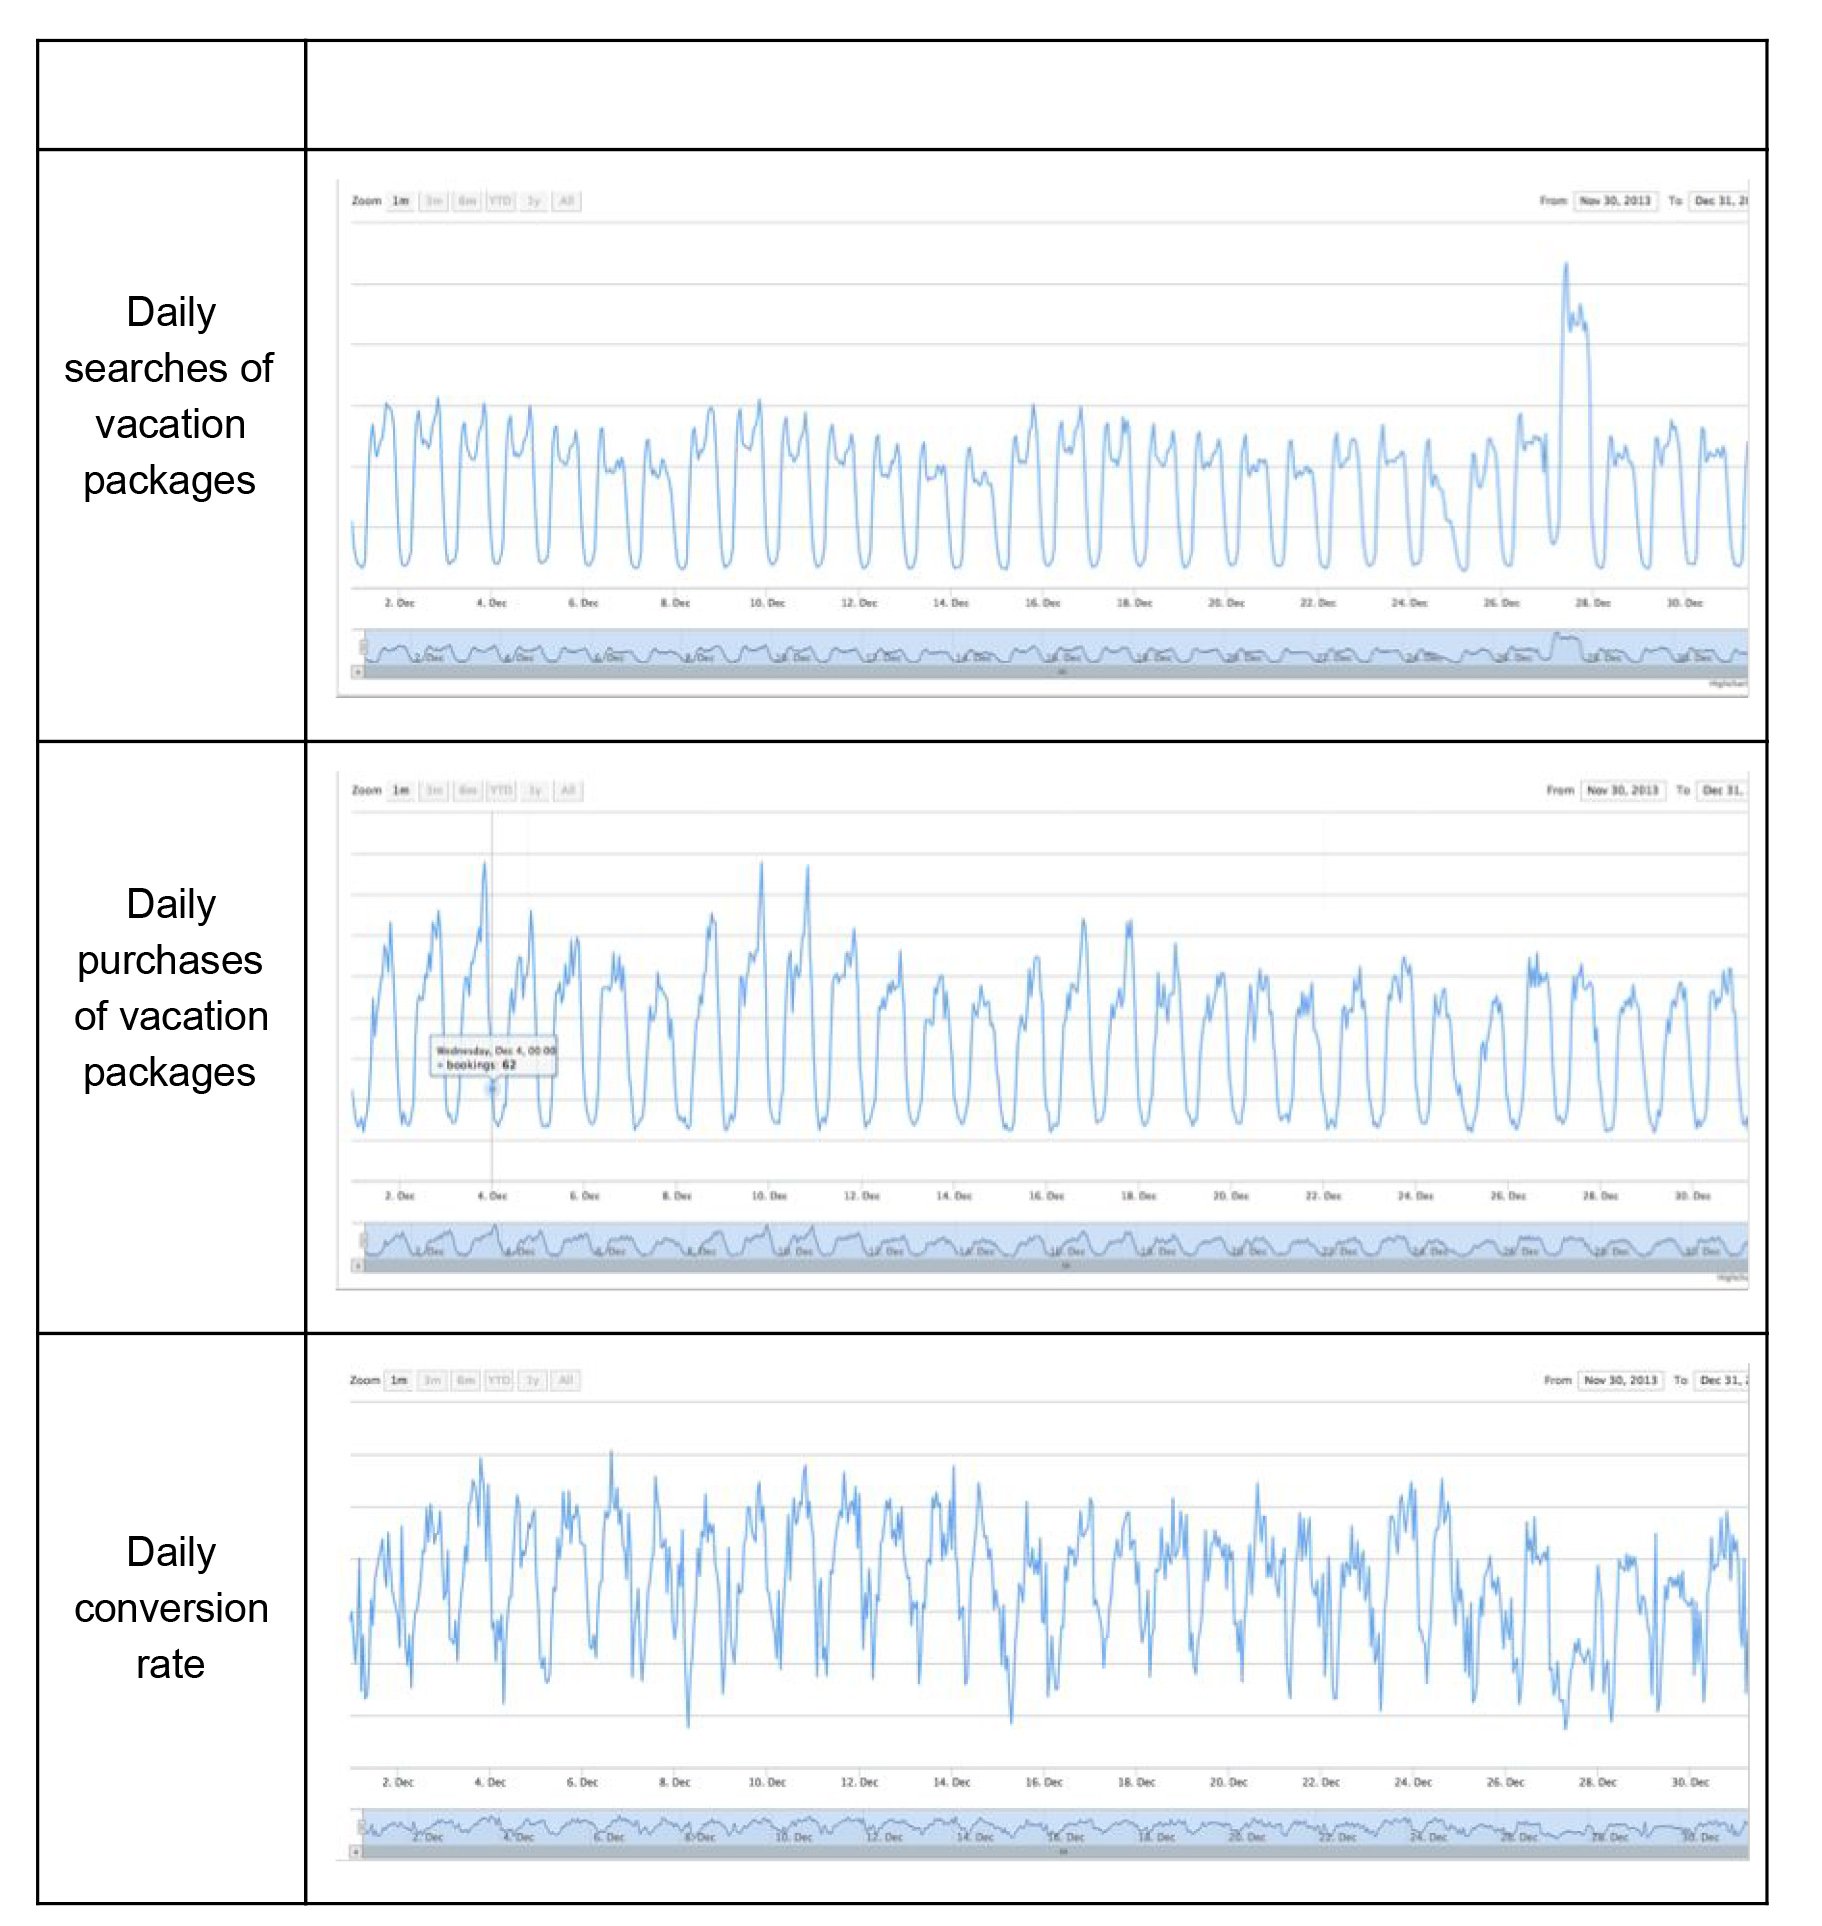
The following are the analyst’s comments regarding the data:
- There are periodic searches of vacation packages
- There are periodic purchases of vacation packages
- The set of conversion rates also has periodicity
- They sell 100 vacation packages per week
John analyzes this information and he comes up with the following questions:
- Can we know in advance how many searches will be done?
- Can we create an alert system in order to be notified when the number of expected packages isn’t reached?
The team of analysts faces a difficult challenge even though they are able to answer all his questions. The main objective of the team is to build a software which can do the following tasks:
- Predict searches, purchases and conversion rates of the vacation packages.
- Inform John when there is abnormal activity in the software.
His analyst has to use both techniques and Big Data technologies. First, he tests several mathematical methodologies to know the periodicity of the time series. He tests the following methods:
After working with those methodologies, the analyst concludes that the most interesting one is Wavelets due to its versatility and comprehensive study of the amplitude and frequency of the series. The team using Wavelets methodology finds the following result:

The chart above shows a time series of the product ‘Africa safari’.
The team of analysts also compares the web traffic for different days of the month which fall on the same days of the week:
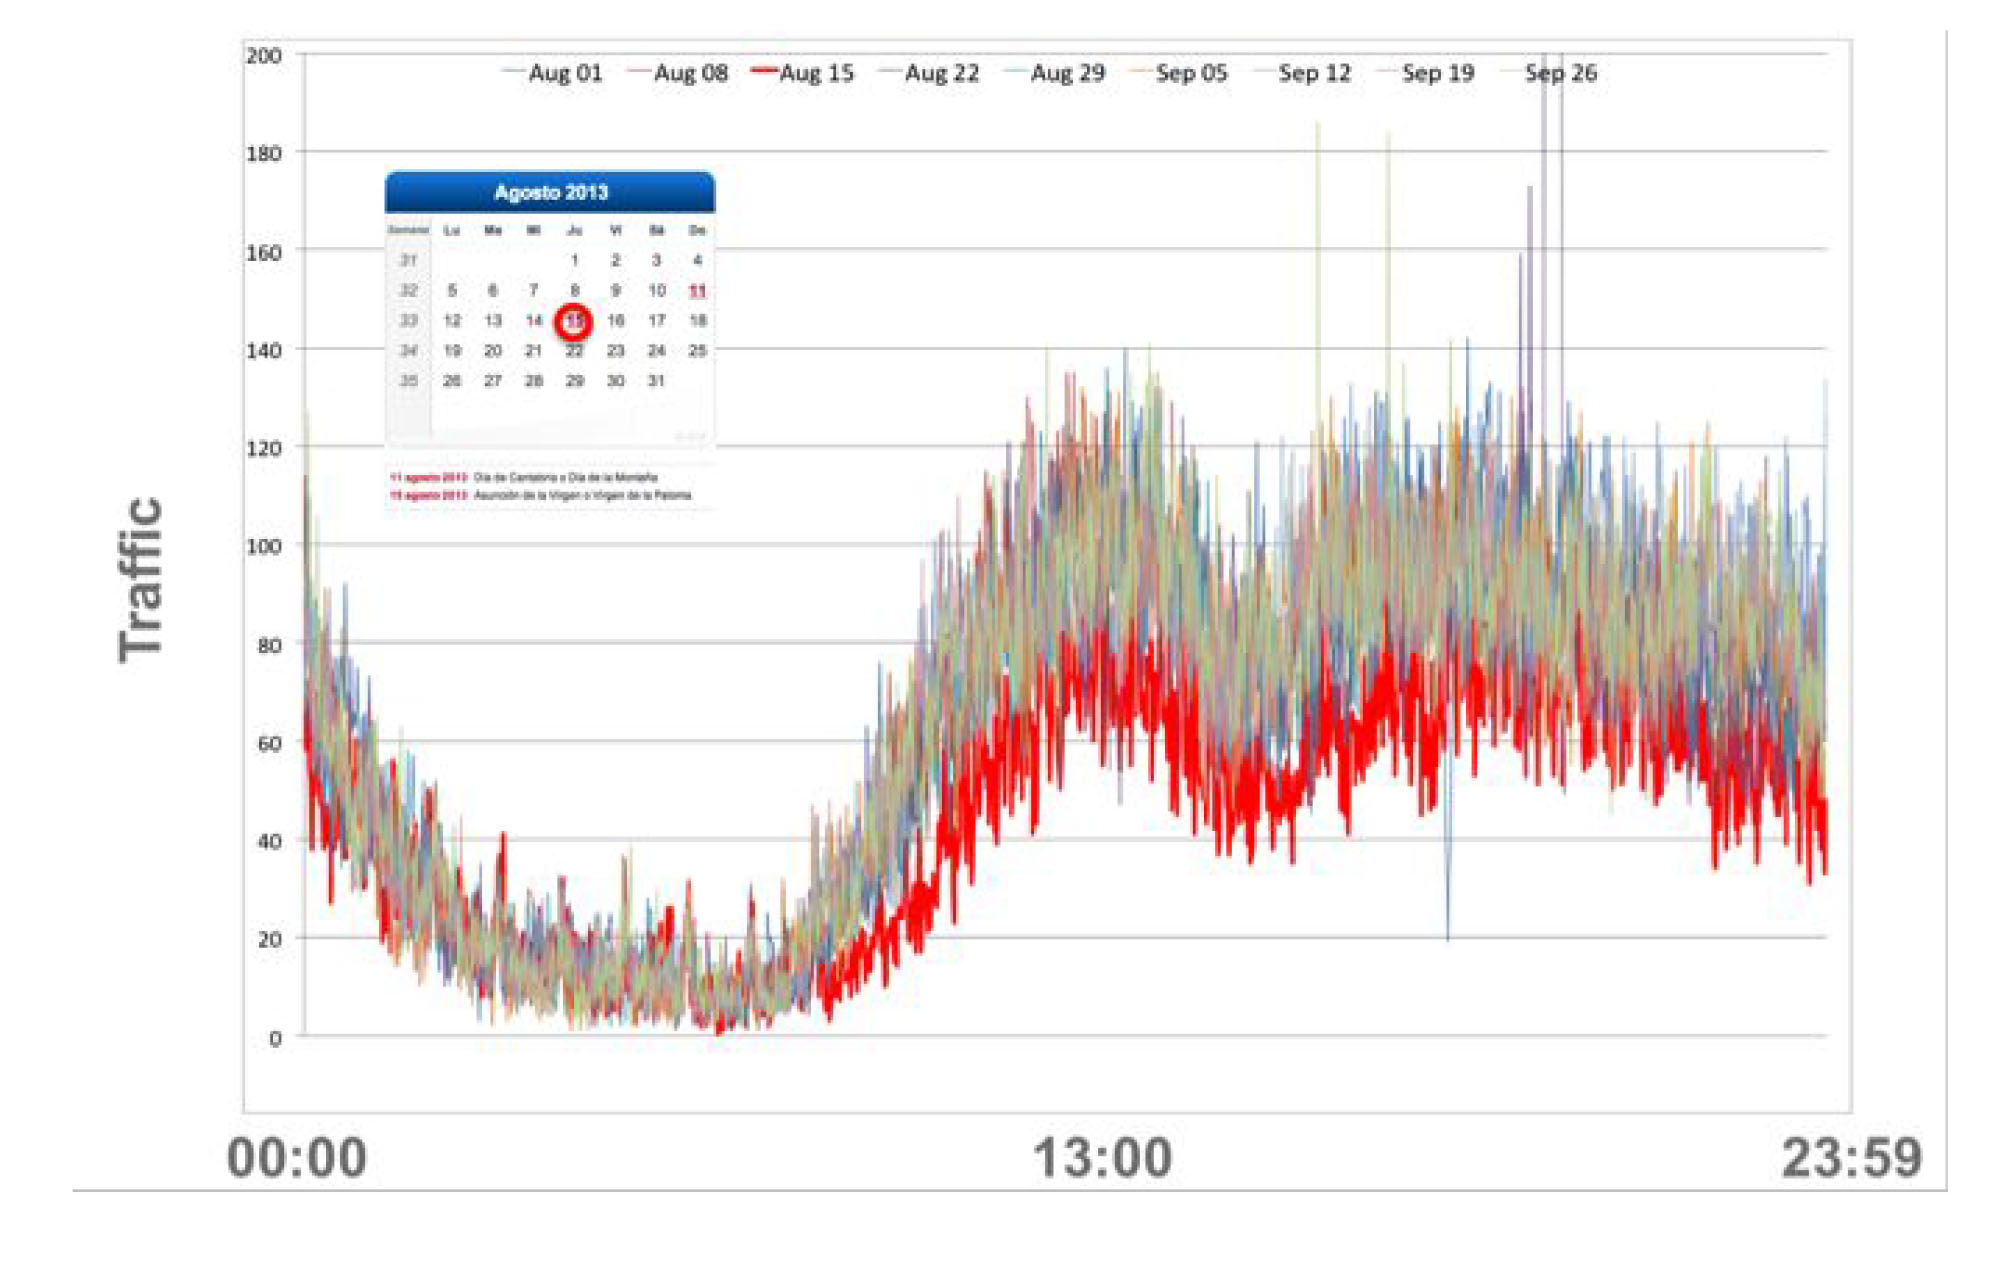
There is a holiday on August (red). The other days of the week have a similar web traffic. The team concludes that there are fewer searches of trip packages on holidays.
The team has performed several tests and experiments using different methodologies and they came up with the following results:
- The serie is repeated on a regular basis day by day and hour by hour.
- There are some anomalies that can be detected with a data analysis.
- They can create an algorithm which will be able to learn from past data and make predictions for each hour and for each day of the week.
- The work schedule is essential for the construction of the algorithm.
The team builds 3 different algorithms for the predictions and they test them on real data. The 3 algorithms provide great results (the precision is between 89 and 93%). However, given the expected growth of the firm, they should implement an algorithm that meets the following conditions:
- It need to be scalable so it can properly manage the future growth of the database. John's business will grow in users and products.
- It has to be parallelizable for getting short calculation and response times. In this case for the software to work in real time.
- It should be fault tolerant to keep the system running in case of failure of one of the hardware machines that supports it.
Finally, the analyst team finishes its work. Now John has a predictive software which can detect anomalies in real time.

The graph above shows 3 time series. The blue one shows real time. The black one is an 80% prediction and the green one a 95% prediction.
If there is an anomaly (i.e. if the real series and the predicted series differ by more than 20%), the system sends you a notification.
Real vs Normal Traffic (0.80 vs 0.95)

Residual's between Real and Normal Traffic

Now John has a predictive system! The design allows him to implement it in each new vacation package as it comes up.
Using this, his goal is to convert the searches into purchases . Therefore, he has made the following decisions:
- He will hire 3 people in order to provide a customer service 24/7.
- A chat system has been installed in the website so that customers can quickly get answers to all their questions.
- He has hired a marketing agency to increase web traffic.
- He has installed a system which asks their customers “What is your favorite destination?” when they're buying a package.
One year after implementing this process, John has achieved the following:
- The traffic has increased by 30% to approximately 1,000 visits per day.
- He has sold on average 150 packages per week equaling sales of €8.5M.
- He has found that Asia is a very interesting tourist destination in which he could create a new travel package.
John is delighted with his investment.